Service hotline
+86 0755-83975897

Release date:2024-09-19Author source:KinghelmViews:1717
Summary
Over the past decade, the global connector industry has consistently delivered impressive financial results, marked by a strong average net income of 10.5% of sales and a notable Return on Equity (ROE) of 15.5%. Despite experiencing a few years of sales decline, the industry has maintained its profitability and high performance, thanks in part to leading companies like TE Connectivity and Amphenol. This sustained financial success underscores the sector's resilience and attractiveness to investors and acquisition-driven companies. The following details delve into the industry's profitability trends, price dynamics, and performance relative to other sectors.

Image from Internet
The connector industry is renowned for its stability, consistently achieving double-digit net income and ROE year after year, making it a lucrative sector for investors and stakeholders. As illustrated in the chart below, from 2014 to 2023, the industry maintained an average net income of 10.5% and an ROE of 15.5%.
Leading connector companies such as TE Connectivity and Amphenol have been at the forefront, driving industry profitability and setting benchmarks for other market players.
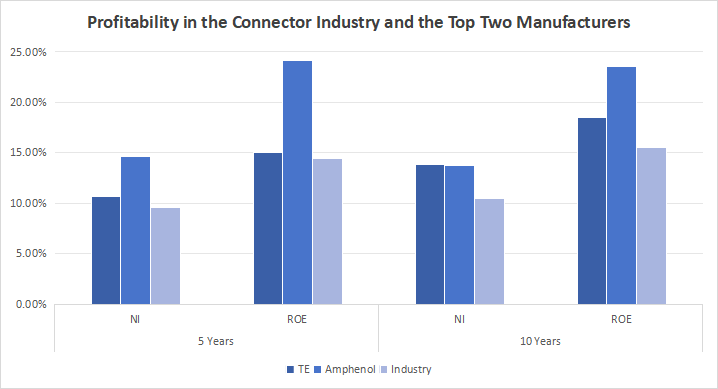
Clearly, the connector industry has excelled with sustained double-digit net income and ROE over the past decade. How does this compare to other industries?
The chart below provides a comparative analysis of net income across various industries in 2023, highlighting the competitive advantage of the connector industry in terms of profitability.
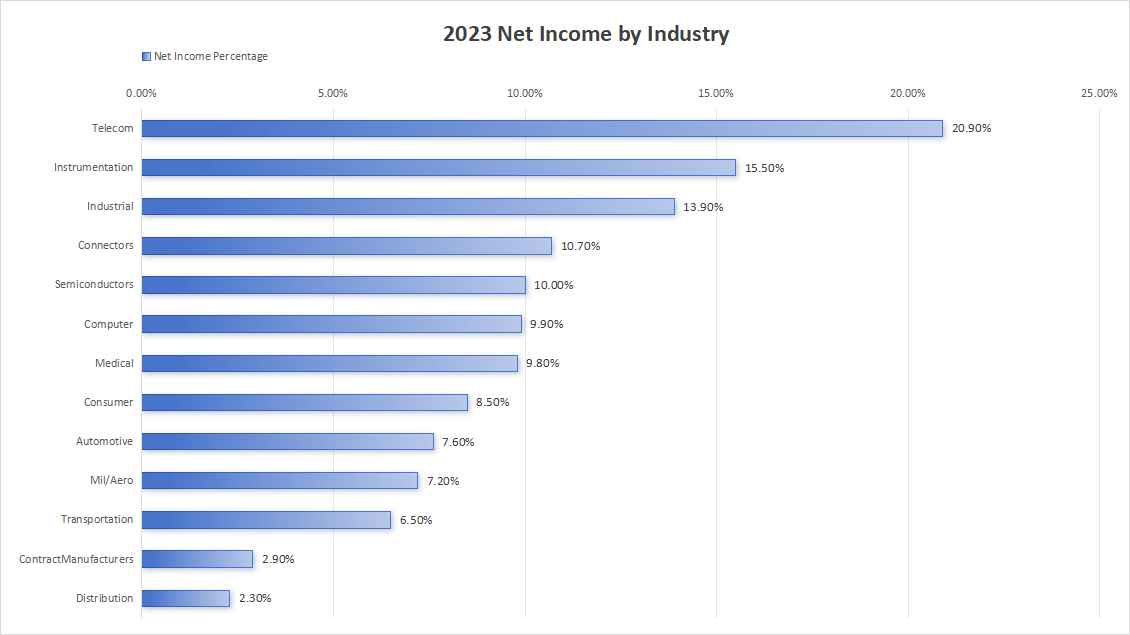
In 2023, the connector industry ranked fourth in overall profitability among the 14 industries we analyzed. While this analysis is based solely on the data from 2023, an industry that consistently achieves double-digit net income and return on equity will always remain ahead.
In light of this, we believe it would be interesting to study how sales performance, global GDP, and connector prices impact industry profitability. In this regard, we have prepared the chart below.
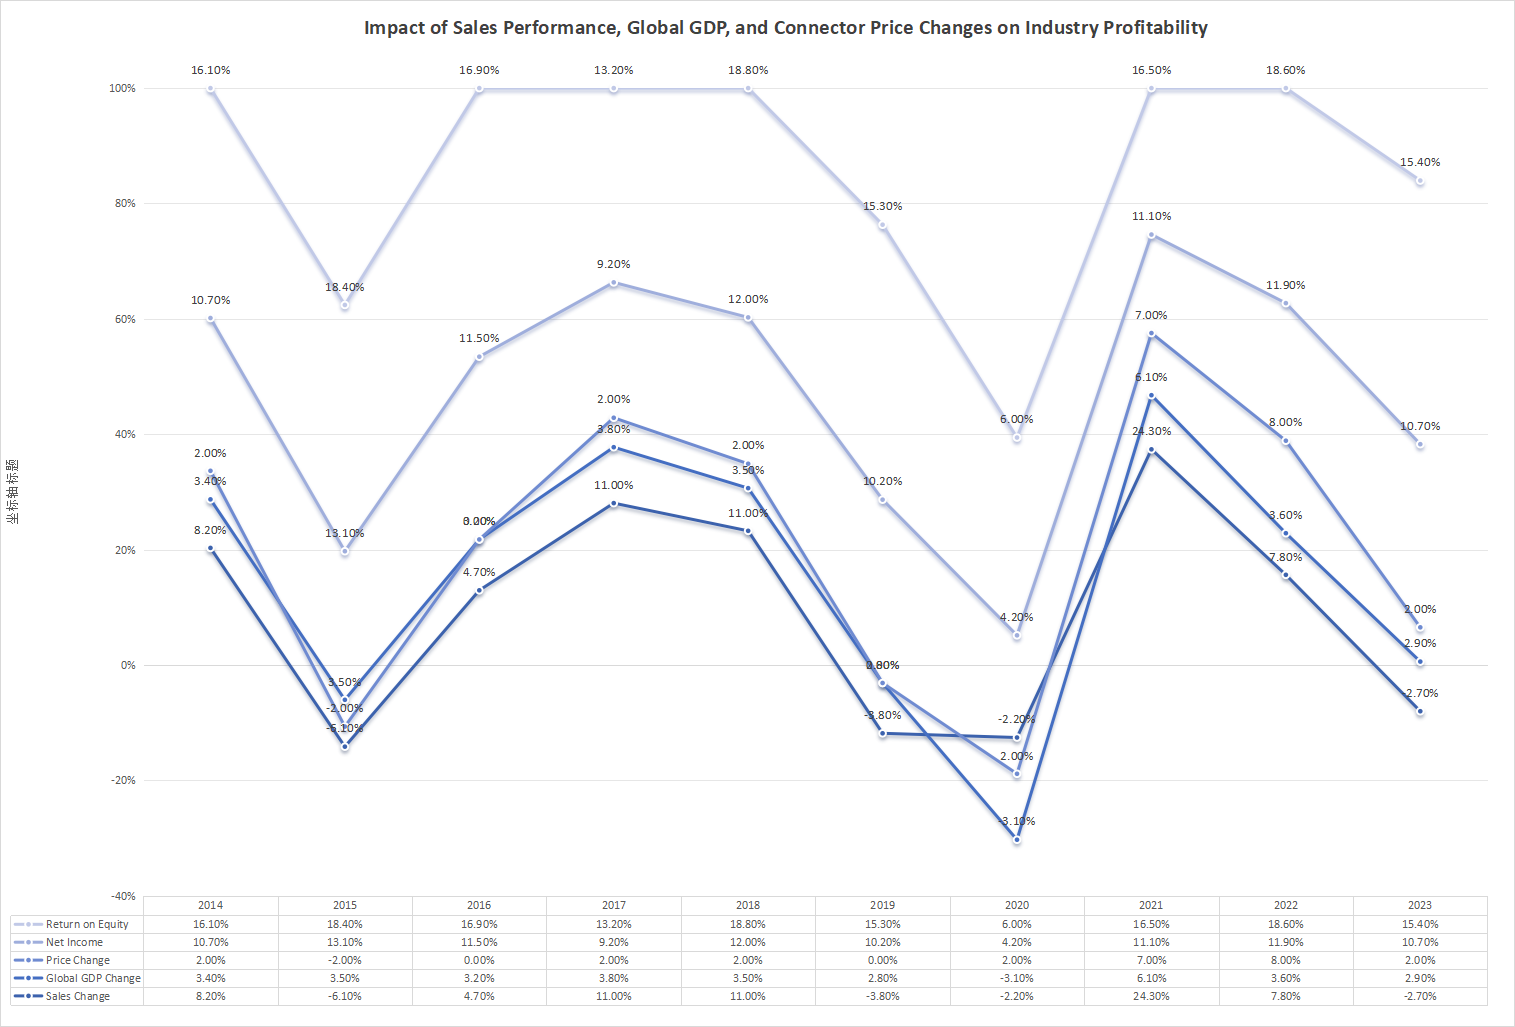
It is also interesting to explore how sales performance, global GDP, and connector prices influence industry profitability. The chart above offers insights into key financial trends and patterns in the connector industry over the past decade:
● Over the past 10 years, industry sales experienced declines in 2015, 2019, 2020, and 2023. Despite these downturns, the connector industry continued to generate substantial profits.
● Connector prices have generally risen or remained stable over the past decade, with only a -2.0% decrease in 2015. Price erosion has been minimal during this period.
● Even with a -3.1% GDP in 2020 and a -2.2% drop in connector sales, the industry remained profitable.
● 2021 and 2022 were particularly strong years, with ROE reaching double digits at 16.5% and 18.6%, respectively. Sales grew by +24.7% in 2021 and +7.8% in 2022.
● The industry was also able to increase connector prices by +7.0% in 2021 and +8.0% in 2022.
● Historically, price erosion has hurt profitability, while, as demonstrated in 2021 and 2022, price increases can effectively boost profitability.
In summary, the connector industry continues to generate significant profits and impressive ROE, enhancing its appeal to investors and acquisition-driven companies. This sustained profitability makes it a prime target for industry players and private equity firms.
Disclaimer: The information above is sourced entirely from the internet and does not represent the views of this account. If there are any infringements or objections, please contact us for removal.
Copyright © Shenzhen Kinghelm Electronics Co., Ltd. all rights reservedYue ICP Bei No. 17113853