Service hotline
+86 0755-83975897
Release date:2021-12-28Author source:KinghelmViews:2199
1. Popular science: To produce 5 5G base stations per minute? ZTE is great
The penetration rate of 5G is gradually increasing, and more and more users are living 5G lives. In the field of 5G, ZTE is an enterprise that cannot be ignored. Since the large-scale commercial use of 5G, ZTE has ushered in a wave of development.


At the recent Mobile World Congress 2021, ZTE stated that its Nanjing Binjiang 5G production base has achieved the achievement of producing 5 5G base stations per minute, and the products are sent to the world. Moreover, the development potential of 5G in the iterative development period is gradually emerging, the number of 5G base stations will continue to grow, and the second half of this year may usher in the large-scale shipment and construction of 5G base stations, which is also an opportunity for ZTE.


2. Popular Science: Signal and Spectrum Knowledge!
1
Introduction to Signals
Introduction to signals
We often encounter signals in our lives. For example, stock charts, pulse charts of heartbeats, and so on. In the field of communication, whether it is GPS, mobile phone voice, radio, Internet communication, what we send and receive are signals. Recently, the Shenzhen subway communication system is suspected to be in conflict with the WiFi signal, that is, the subway antenna received the WiFi signal, and the signal was mistakenly regarded as the subway communication signal. Our social informatization is built on the basis of signals.
A signal is a sequence that varies in time or space. In signal processing, we often use "signal" to refer to a one-dimensional signal, that is, a sequence that only changes with a single time or space dimension. Such a signal can be mathematically expressed as f(t) or f(x) a function. Corresponding to a one-dimensional signal is a multi-dimensional signal. For example, an image is a two-dimensional signal, which changes with the two spatial dimensions of x and y, and is mathematically expressed as f(x, y). Below, unless otherwise stated, "signal" is used to refer to a one-dimensional signal.
Even though signals are so widely used, there is nothing mysterious about signals in the mathematical sense, just ordinary sequences (functions). The method of signal processing can be applied to signals in any field (whether it is communication, finance or other fields), which is also the charm of signal processing.
2
simple harmonic
Sine waves and cosine waves are collectively referred to as simple harmonics. Simple harmonics are the most common fluctuations in nature.

sine wave
A sine wave can be written as a function:

It can be seen that a simple harmonic has three parameters, amplitude (A, amplitude), frequency (f, frequency), and phase (phi, phase). These three parameters control different characteristics of the sine wave, respectively. By adjusting them, we can get different sine wave signals.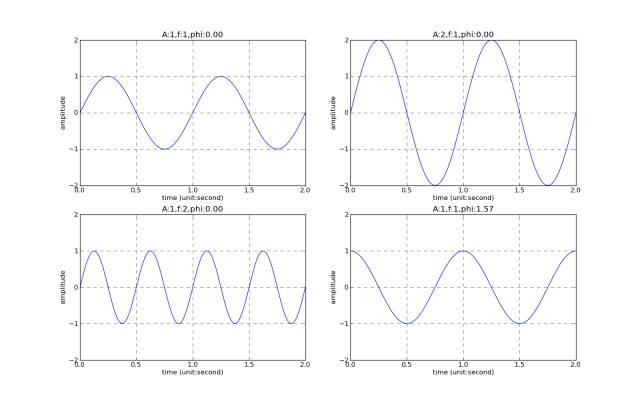
Top Left: Original Top Right: 2x Amplitude
Bottom left: 2x frequency Bottom right: phase shift
It can be seen that the higher the frequency, the denser the "mountains". The higher the amplitude, the higher the "mountain". The phase changes, and the position of the "mountain" moves left and right. (Friends say that I "control the tone with the volume": when singing should change the frequency, it is changing the amplitude.)
The functional form of cosine wave is similar to that of sine wave, which is represented by cos. We can get a cosine wave from a sine wave by changing the sine wave.
3
Fourier transform
Simple harmonics, although simple, have important implications for signal processing. Fourier was an engineer who discovered that virtually any signal can be approximated by the addition of simple harmonics. That is Fourier's theorem (Fourier inversion theorem): any signal can be obtained by adding simple harmonics. Therefore, complex signals can be decomposed into many simple harmonics. A signal is obtained by adding simple harmonics of multiple frequencies. A simple harmonic that makes up a signal is called a component of the signal.
For example, the figure below shows how we can use the superposition of simple harmonics to continuously approach the blue signal:

Wikipedia
The Fourier transform is a set of fixed calculation methods used to calculate the various components of the signal (that is, an, bn above). In signal processing, the signal can be Fourier transformed and converted into a combination of simple harmonics. By separately controlling the simple harmonic components at each frequency, we can perform signal processing more efficiently. For example, when we communicate, we can use high-frequency simple harmonic signals. But the antenna that receives the signal may receive interfering signals from other frequencies. At this time, we can perform Fourier transform on the received mixed signal, and only extract the high-frequency components of the target. This is a common method for reducing signal noise. The process of Fourier transform is a bit complicated, but there are already plenty of programs that can help you with it. All you need is the input signal, and the computer will figure out its components for you.
For example, if the signal f(x) is periodic, we can transform it into:

That is, a signal can be seen as the sum of many simple harmonics. The above a and b are parameters that can be obtained from the original signal:


a, b represent the strength (and phase) of the simple harmonic components of the signal at each frequency. In this way, the signal is decomposed into the sum of simple harmonics. Since simple harmonics are relatively easy to understand, we can understand the mechanisms behind complex signals by studying these components.
4
spectrum
Through Fourier transform, we can obtain the simple harmonic components of different frequencies of a signal f(t). The amplitude of each component represents the strength of that component. By drawing the strength of each frequency component, the spectrum of the signal can be obtained. For example, the following image is the spectrum obtained from the daily precipitation series:

It can be seen that the simple harmonic component with a period of 1 year has an obvious peak. That is to say, the weight of the one-year cycle is relatively strong. There are physical reasons for this. Because precipitation always changes regularly with the four seasons of the year. Through Signal->Fourier Transform->Spectrum, we can understand which simple harmonic mechanisms are synthesized by complex signals from the perspective of simple harmonic components.
The Fourier transform can also be used for multidimensional signals. Apply the Fourier transform to a two-dimensional signal, i.e. an image:

On the left is the 2D signal (image, f(x,y)). Black and white can be represented by numerical values, that is, signal values. On the right is the spectrum of the 2D image. The X-axis represents the frequency in the x-direction, the Y-axis represents the frequency in the y-direction, and black and white represent the amplitudes of different frequency components. In the lower row, Lenna has been intentionally added with noise and caused a corresponding change in the spectrum. The center of the spectrum represents the amplitude of the low-frequency signal, and the part of the spectrum far from the center represents the amplitude of the high-frequency signal. We compare below with the image with added noise.

Lenna and her spectrum
Now, add noise to the image. As you can see, many small "spots" have been added all over the original image. These spots are mixed with the original signal. It's hard to pinpoint these noise points one by one. But on the other hand, these noises have certain characteristics: the spatial scale (i.e. size) of these noises is small.
This understanding of image noise can be confirmed from the spectrum. As you can see from the spectrum on the right, the high-frequency signal (the off-center part) is significantly enhanced. The high-frequency components are corresponding to signals with small spatial scales. It can be seen that the noise is in the frequency spectrum and concentrated in a specific region of high frequency. In this way, the noise mixed with the original image is spectrally distinct from the image. Through high-frequency filtering technology, noise can be filtered out. This is also a great way to denoise images.
(If you know anything about image processing, you'll know the name Lenna. She's a Playboy girl, but also a goddess of image processing. You can search for "Lenna full image" to find the full image. Lenna Now an old lady who "witnessed" the development of image processing.)
5
Summarize
Signals can be decomposed into simple harmonic components at different frequencies. This helps us better understand complex signals. The Fourier transform is a fundamental tool in signal processing (and image processing). Through Fourier transform, we can obtain the frequency spectrum of the signal.
The frequency spectrum gives us another perspective on understanding the signal. In the world of frequencies, we can find a lot of information in the original signal that may be overlooked, such as seasonal changes in precipitation, such as enhanced noise.
The "Kinghelm" trademark was originally registered by the Golden Navigator Company. Golden Navigation is a direct-selling manufacturer of GPS antennas and Beidou antennas. It has a very high reputation and reputation in the Beidou GPS navigation and positioning industry. Its research and development products are widely used in bds satellite navigation and positioning wireless communications, etc. field. The main products include: RJ45-RJ45 network, network interface connector, RF connector adapter cable, coaxial cable connector, type-c connector, hdmi interface type-c interface, pin header, SMA, fpc, FFC Antenna connector, antenna signal transmission waterproof connector, hdmi interface, usb connector, terminal terminal line, terminal board terminal block, terminal block, radio frequency rfid label, positioning and navigation antenna, communication antenna antenna cable, glue stick antenna suction cup antenna, 433 antenna 4G antenna, GPS module antenna, etc. Widely used in aerospace, communications, military, instrumentation and security, medical and other industries.
This content comes from the network/filter. This website only provides reprints. The opinions, positions and technologies of this article have nothing to do with this website. If there is any infringement, please contact us to delete it!




Copyright © Shenzhen Kinghelm Electronics Co., Ltd. all rights reservedYue ICP Bei No. 17113853